Tuning vCenter Operations Manager – Going from OMG THE SKY IS FALLING to Relevant Alerts
If you’re new to vCenter Operations Manager or vCOPS as it is called (And that’s vCOPS and not VC Ops even though VMware wants you to believe that is what it is called…. ;)) You may notice that once your environment starts collecting data you’ll be getting alerted to everything under the sun, and thensome! And let me tell you, that is AWESOME! Please do tell me about everything going on as that is beneficial and useful. As the days, weeks and months drone on though, you really could care less about being alerted that your thick-provisioned Datastore which is maxed out by configuration is full. WE GET IT. IT’S FULL. STOP TELLING ME ABOUT IT! Or that your Security Scanning server (Pick Retina, Nessus or your favorite choice) uses >100% CPU when the process is running. Totally get it. It’s not undersized, it’s just not USED except for when it is running, throwing more resources won’t make it faster or better.
HOW DO i STOP IRRELEVANT ERRORS FROM ANNOYING THE HELL OUT OF ME?!?!
That’s what this is all about! I’ve taken an environment which would normally have anywhere from 500-1000 “Warnings, Errors, Alerts” on a daily basis, down to where I’m really only seeing what actually MATTERS. Ignoring a majority of the ‘blah crap’ to focus on active alerts as they’re happening. For what its worth, I’d always have the same alerts appear, but the important anomalies were getting lost under the weight of the useless.
To start things off, login to vCOPS and click on the Configuration button 
That seems simple enough, right? Then you’ll want to go in and modify your Default Policy by simply clicking on the blue of “Default Policy”
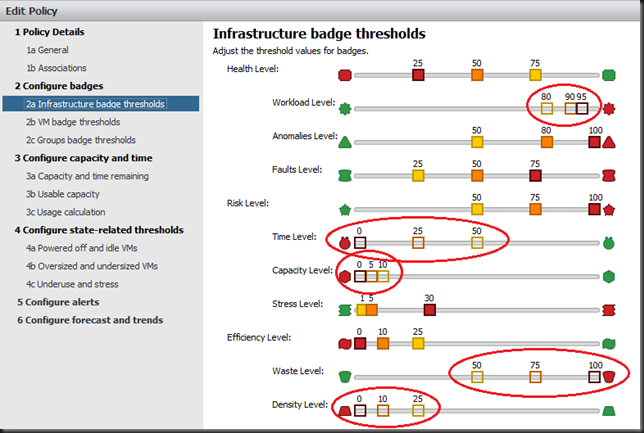
Now this is where we start getting into the meat of things. You may notice I’ve made a series of modifications. These are the Infrastructure Badge thresholds which apply to the Infrastructure and not specific to VMs or Groups of VMs. Workload level while cute and all tends to annoy me more than not in my system as you can see I had originally kept increasing the threshold higher and higher (80,90,95) eventually just clicking on the square which “turns off” that particular alert. Next the Time Level function keeps tracking Timing which I’ve found to be less useful on a day-to-day alerting basis. Long-term the data is still collected and I can report against it, so I leverage the reporting function as needed. When it comes to Capacity Levels, this applies to Capacity available in the Infrastructure (Datastores, etc) which frankly I keep an eye on personally. If you find yourself thin provisioning by default then keeping a feature like this activated is likely important to you. I have over 100 datacenters and ensure they’re not over provisioned, because being told 100+ datacenters are “full” or “near full” is just useless and annoying. Then when it comes down to Waste Level and Density Level, I keep a tight hand on how that is handled within the Infrastructure so I also have it turned off. Again, judge your environment based upon your needs. You can always turn functions back on or tune them.
VM Badge Thresholds are a little more important than Infrastructure in this regard. I like to be alerted that my Workload is high but only to the point where it is basically maxed out. Adjust accordingly based upon knowing your environments use and function. If you have dozens of VMs which regularly butte up against this ceiling as part of their function you may find yourself tuning this up higher as well. vCOPs likes to predict the timing of things and be all like OMG YOUR VM IS GOING TO RUN OUT OF CPU or something. Yea. Thanks for the offer, but I’ll run a report for Undersized VMs and know that a majority of VMs are oversized to start with. So I turned this off. :) You’ll note that Capacity Level is configured and activated, because here I DO want to know if the VMs hard disk is going to run out of disk space (or is out). That’ll impact things so I leave that on. Same as above for Waste and Density.
I’ll be honest. I don’t use Groupings here because things are more isolated than they are ‘paired’ and I don’t need this calling out any false positives. Consider that for your environment. If you heavily use Grouping, awesome, definitely take advantage of this!
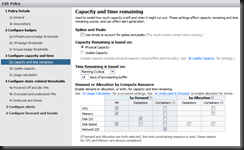
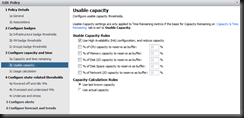
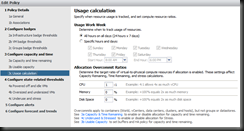
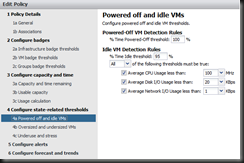
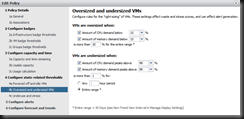
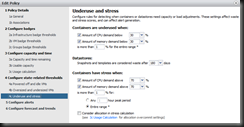
I’m not going to dive into the details of these next few tabs and instead will show you what MY settings are, but for the most part they’re less important than the first few tabs and the last few tabs.
This is really where the rubber meets the road with the Alerts. All of the configuration we made above while important comes into stride with what you have configured for Alerts. You may notice that I monitor Workload on Infr and VMs but not Anomalies. Anomalies are cute and insightful… and very important if you have applications which are anomalous in nature. If you don’t though, EVERYTHING will report anomalies to the point of being annoying and useless. What that means is, when you’re alerted on anomalies, you’ll spend more time chasing false positives than actual problems. Yea you may get lucky… but if you understand your environment enough, you’ll get annoyed and turn this off just as I have. :) Time remaining and Capacity remaining while deactivated on my Infrastructure is valid on my VMs (I’ll be honest…. I’m not sure why I have Time Remaining even on for VMs, but Capacity Remaining will identify if I’m running out of VMDK Harddisk space, so yay!)
While we did ignore Anomalies, I do not ignore Stress, as that’s an actual active task going on at the time of true stress on the system. That’s important and lets you know something is happening, not simply something is high or low from it’s established pattern as an anomaly would detect. And lastly… Waste and Density… Just don’t matter to me when I have this architected specifically for my needs. Clearing that along got rid of a large chunk of erroneous alerts.
And lastly the Forecast and Trends function… Okay, seriously, there’s no reason this should be highlighted any more than just merely reviewed. See how your environment compares but there’s nothing too important to call out here, but I since it was the ‘6th’ tab, I couldn’t omit it. :)
Nothing beats a good understanding, architecture and design
vCOPS as we all know is a tool, and how you use that tool or respectively let it use you is important. When getting started with vCOPS drink from the firehose, tune your things so you see everything, even more than everything and scour and look at every single tab, function, report and alert!
Then, once you’ve tuned your environment down and understand your limits start to scale it back so it becomes useful. Hopefully some of the settings included here help you. I literally went from thousands, THOUSANDS of alerts on my many hundreds of Datacenters, vCenters and beyond and on a good day can have –0- messages warning me. Yea I said it. –0- ! ! !. But at this point, even on a ‘bad day’ I’m looking at ~25 or so alerts at a maximum when one or more of my datacenters are experiencing some kind of issue.
Give it a try, tune tune tune and enjoy!
