Well, for those of you who have read my “Exposed” expose’ as in the past… I’ll do my best to provide an in-depth coverage of this tool, lessons learned and so much more! Allow me to disclaimer for a moment, this IS a beta, so your mileage may vary and your feedback has a chance to shape the product.
You can read the infamous Jon Herlocker’s breakdown of the tool at the Office of the CTO Blog; Introducing VMware vCenter Log Insight
Jon provides some great stock photos, descriptions, images, use-cases and all that jazz… What I’ll show you, is Production Use, and I won’t be using any screenshots I didn’t take myself! :)
Getting Started with #LogInsight
WTF YOU’RE ALREADY HASHTAGGING IT! Yea I am, but I digress. :) Alright! Let’s focus on getting started! First things first, you should visit the VMware Log Insight Beta Community – There you can join the ‘discussion forums’ okay, I know you won’t seriously do that, but you can download the product!
And once you get it downloaded and you deploy the OVA/OVF you’re pretty much set! You may experience ‘errors’ when going through the configuration process, I personally re-deployed my OVF 3 times (remember, it’s a beta) but once I got past that and little browser mess-ups, it’s been SOLD since!

Look at that, nice clean login… seems pretty straight-forward (hint… it is :))
Cracking Open the Log (insight…)
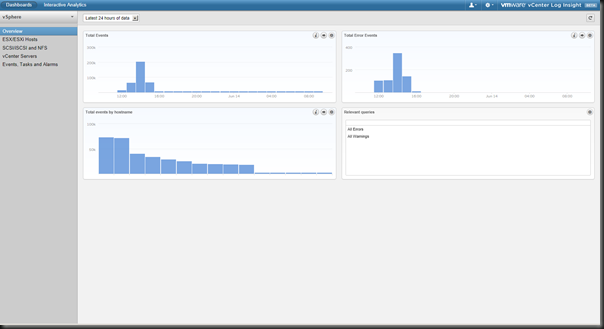
I know what you’re saying DAMNIT MORE BAD LOG PUNS. Yea, that’s right! Alright, so you pop it open and here’s your dashboard! You’ll notice events coming in, very simple interface, perhaps too simple but simple nonetheless. The real keys will come into the next few sections.


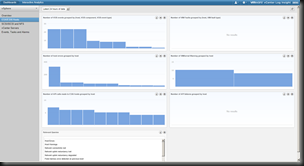
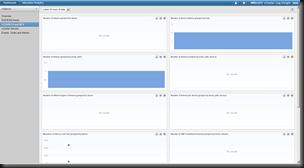
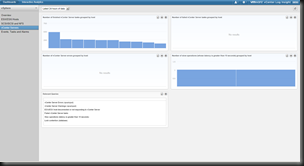
Once you start diving into the details you’ll start to see more and more events coming in, and in their relevant and relative categories.

I want to share with you this little experience… Sometimes you may click on a tab and be all like WTF HAPPENED THERE WERE EVENTS HERE 5 MINUTES AGO. And that’s exactly it. If you’re on the “Last 5 minutes of data” section, you’re literally only going to get the last 5 minutes of data. Expand it out to an hour or so and you’ll start to see those messages you had seen just minutes before!


And lastly your main page happens to list again further various event types of screens… And I get it, this is all nice and interesting, but what does it mean?!
Diving into the weeds

Once you start to get into the “Interactive Analysis” you start to get into the details, or quite frankly into the damn SYSLOGs!

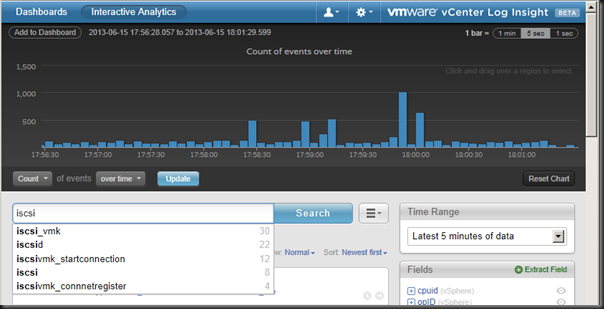
One particularly awesome piece of this is the ability to ‘type’ something into the Search bar. What this does is, it indexes all types of requests in the background and gives you an idea of how many of certain types of events or names shows up. For example, if you specify a Hostname you’ll see how many syslog messages had that hostname, or VM Guest, or you name it. Just type something in, and you’ll start to get some details and insight! (For security reasons.. I chose details which had no particular relevance but still provided you some ‘search’ context!)
Configuring your ESX environment!
You may notice upon reading the manuals which come with the software (hah, you’re never going to read those! ;)) but it comes with a tool called ‘Configure ESXi’ which will configure your environment. Let’s say you’re like me and cannot run that tool, or just outright choose not to… Well, here are some alternatives to get your ESX hosts configured so they can start reporting back to your newly created SYSLOG Server!
OMG THERE’S TOO MUCH DATA
That’s right. You find that your local traffic is okay, but you have a remote site which has a slower link, could be in a different country, or just over a Satellite like or something similarly ridiculous… Well, look no further!
When using VMware Log Insight you may want to change the amount of SysLog data you’re receiving
You can check your current logging levels with this PowerCLI command(s)
- Get-VMHost | Get-VMHostAdvancedConfiguration -Name "Config.HostAgent.log.level"
- Get-VMHost | Get-VMHostAdvancedConfiguration -Name "Vpx.Vpxa.config.log.level"
Chances are you’ll be getting a load of data coming in at Verbose ~1000s, even as high as 5000-10,000 logs in a 5 minute period.
I switched hostagent and vpx levels from "Verbose" to "Warning" and went down to ~10-15 logs for a 5 minute span! If you have low bandwidth links this could mean significantly less impact.
And if you want to outright change those down to Warning as I did, or to any other value (say, Info) you can do it with these handy one-liners!
- Get-VMHost | Set-VMHostAdvancedConfiguration -Name "Config.HostAgent.log.level" -Value "warning"
- Get-VMHost | Set-VMHostAdvancedConfiguration -Name "Vpx.Vpxa.config.log.level" -Value "warning"
HOW THE HELL DO i POINT MY HOSTS TO POINT TO THIS THOUGH!
I’m glad you asked that, I mean metaphorically of course, because I’m writing this, not you! NOT YOU! I went through various iterations to make this possible, and I found setting the Syslog server easy, Configuring the Firewalls equally easy whether via vSphere Client or PowerCLI, but I found the reloading the syslogd to be a pain in the ass. That is until I came across this little gem!
I’d like to note I am stealing/borrowing this from Caleb in his post; Changing VMware ESXi 5.1 Syslog settings via PowerCLI – It worked like a charm and you shouldn’t feel shamed to use it! Be sure you thank Caleb for this code of course!
- get-vmhost | Get-VMHostAdvancedConfiguration -Name Syslog.global.logHost
- #Get Each Host Connected to the vC
- foreach ($myHost in get-VMHost)
- {
- #Display the ESXi Host that you are applying the changes to
- Write-Host ‘$myHost = ‘ $myHost
- #Set the Syslog LogHost
- Set-VMHostAdvancedConfiguration -Name Syslog.global.logHost -Value ‘server.domain.com,server2.domain.com’ -VMHost $myHost
- #Use Get-EsxCli to restart the syslog service
- $esxcli = Get-EsxCli -VMHost $myHost
- $esxcli.system.syslog.reload()
- #Open the firewall on the ESX Host to allow syslog traffic
- Get-VMHostFirewallException -Name "syslog" -VMHost $myHost | set-VMHostFirewallException -Enabled:$true
- }
And honestly, that is about it! Once you’re set with the right level of verbosity of information, and syslogs pointing to your newly built VMware Log Insight server… then it’s just a matter of collecting, and reviewing with the occasional troubleshooting as needed.
I did come across this little bug which I’m sure they’ll fix eventually..

If you’re not seeing the bug, it simply is, if you have the Log Insight log viewer NOT in full-screen mode (like you have half the screen showing log insight, and the other half, oh I don’t know… with VLC finishing off the 4th season of Battlestar Galactica…) it’ll seemingly ‘truncate’ the text on the screen, instead of simply moving to the next line. I’m sure it’d be pretty easy to fix, so don’t get too annoyed by it! :)
In Summation or Building a Log Cabin for your troubleshooting…
Wow, you couldn’t let it go without another bad pun? Yea, probably not… :) There is a lot more to this tool than I could show you, unfortunately there are screens… which I could not edit down enough without destroying the value of what you’d be seeing. This tool has vCenter Operations integration, the ability to pull and index all of your data points! I can see at a glance errors which are showing up, and then drill-down to find similarly correlated errors. I mean, the tool isn’t overly too intelligent yet, but that is bound to come in time, and through our suggestions I hope!
I encourage you to check it out, especially if you don’t have something in place pulling your syslogs today, like Kiwi or Splunk. This gives you a ‘single family’ set of solutions which in the end will have your virtual best interests at heart. So check out the beta and let me know what you think. I’ll keep rocking this tool out and continuing to pull in and index my extremely enormous virtual environment! Enjoy!


